Node.js 20 or newer
The dashboard is a Node server with zero dependencies. Check with node --version.
Local Ollama dashboard
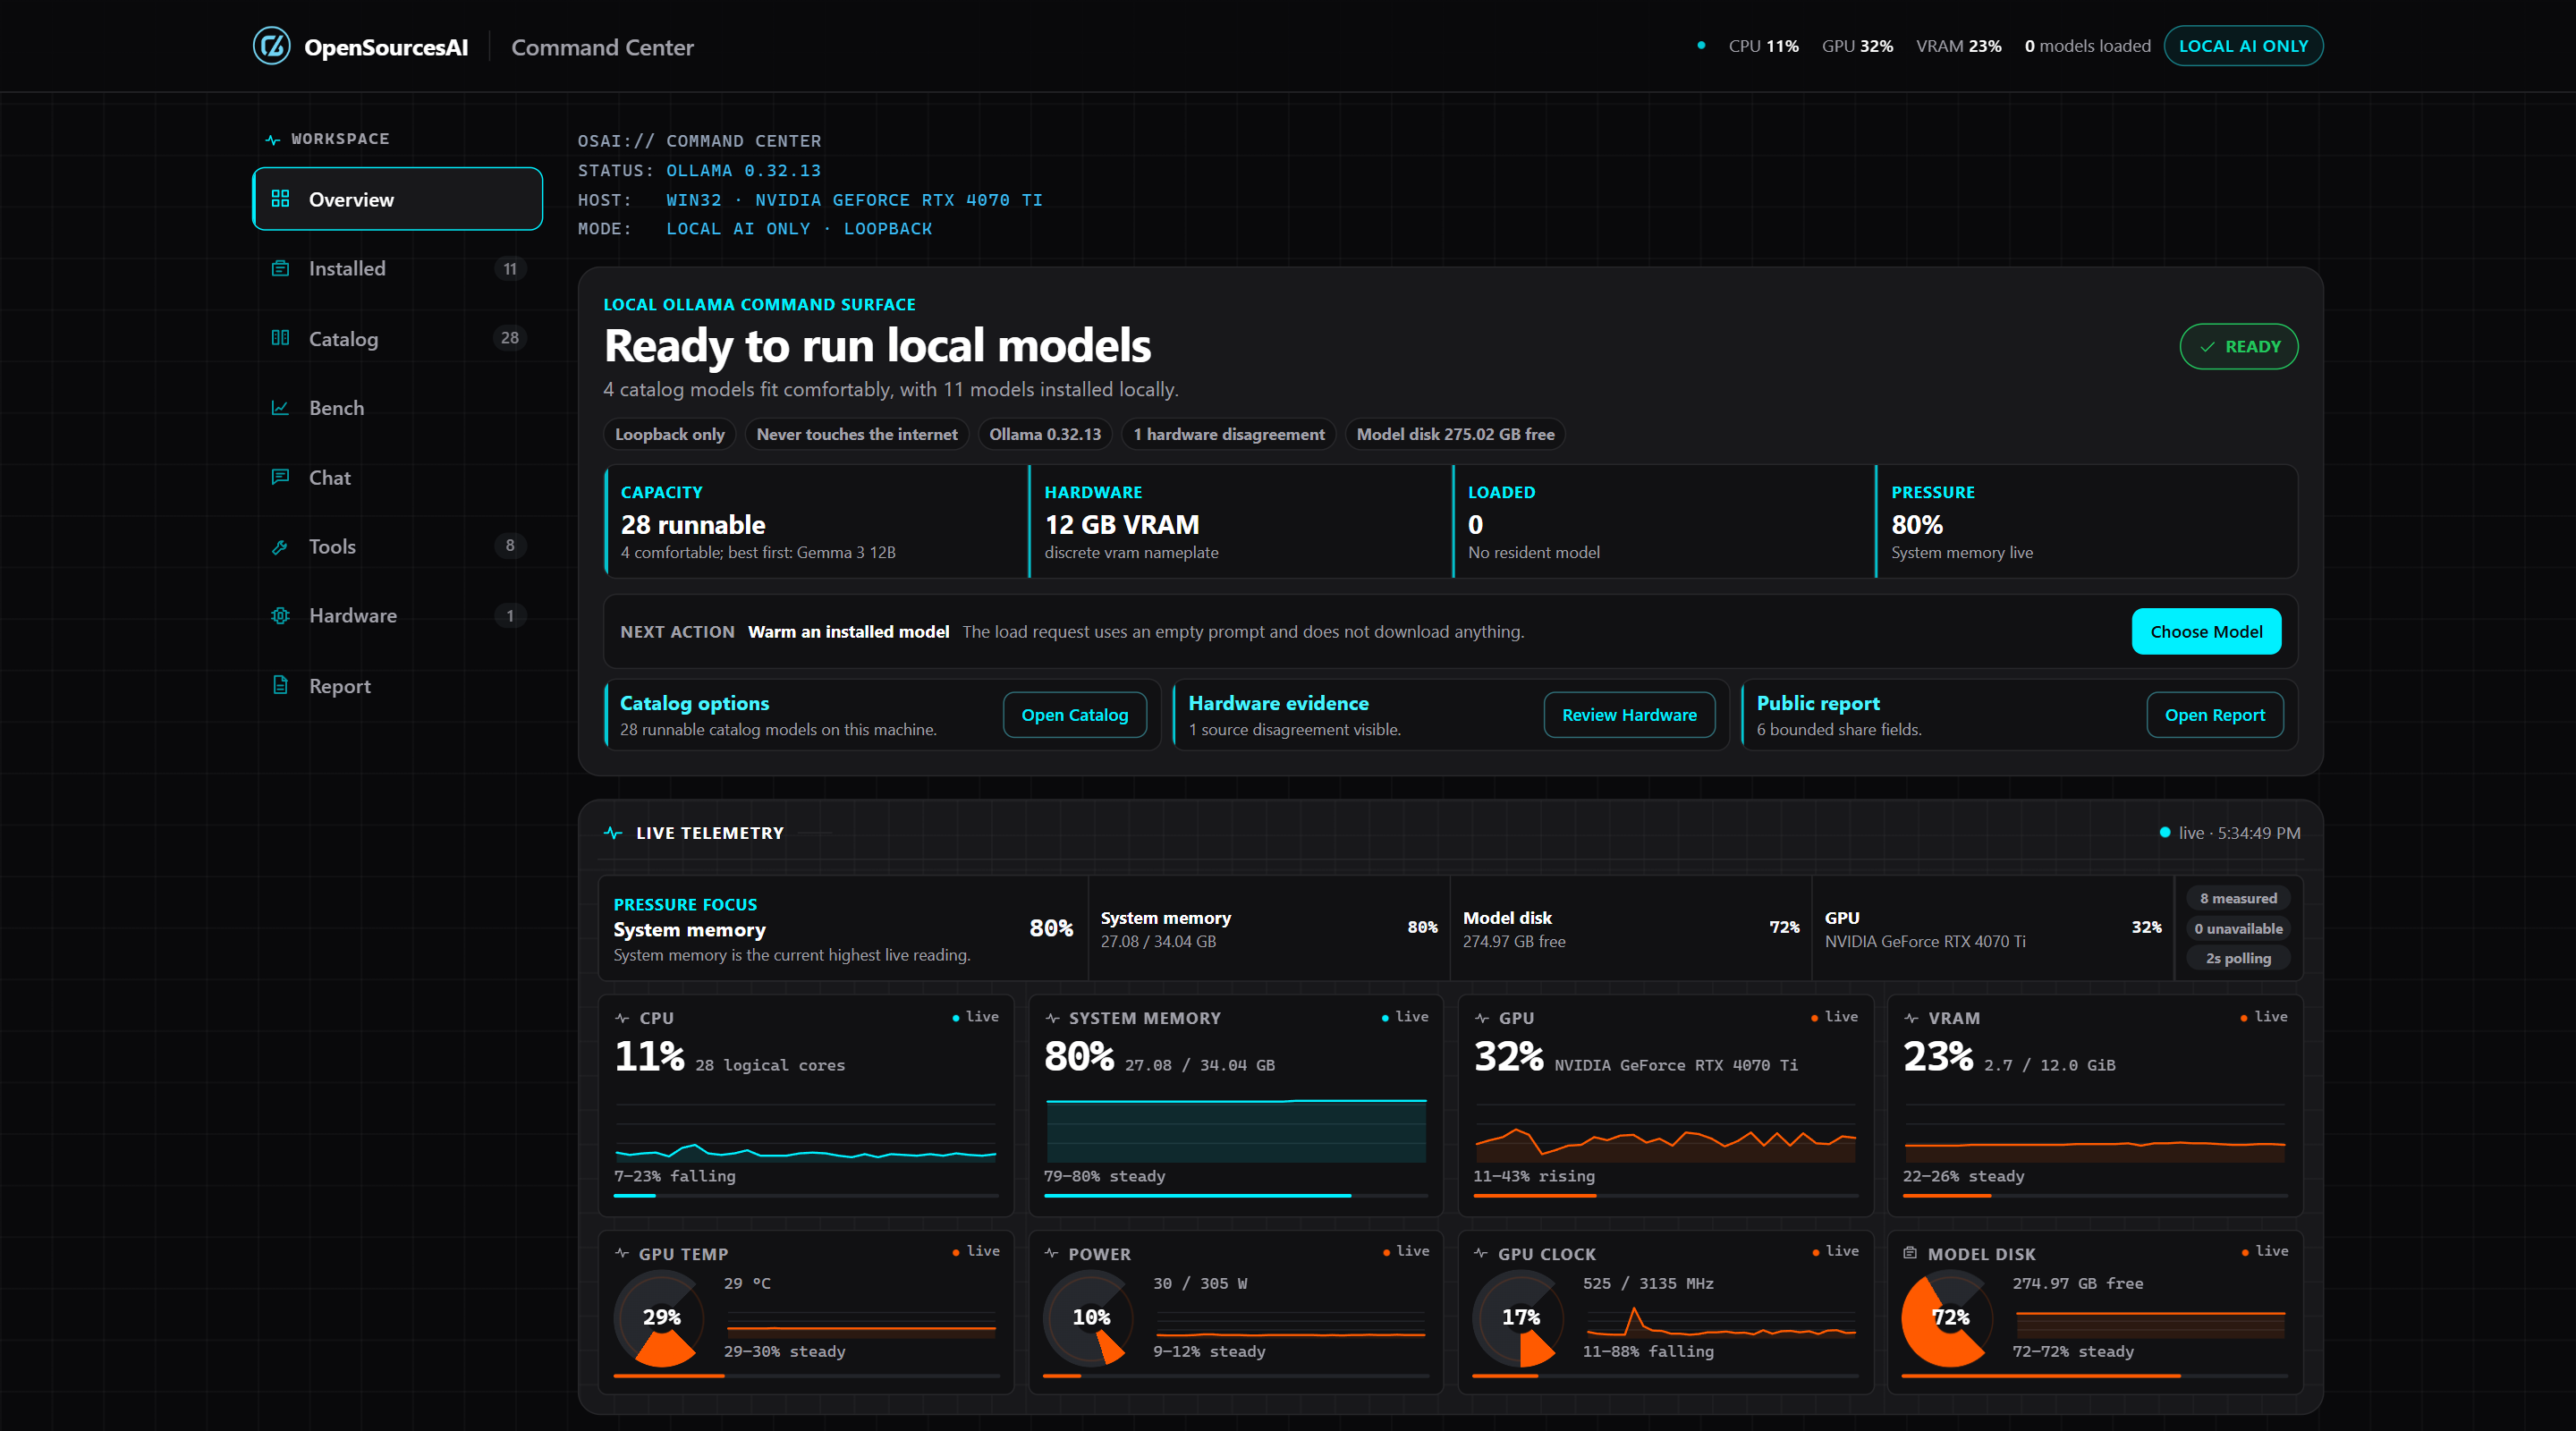
Command Center reads your hardware and your running Ollama setup directly: detected GPU and VRAM instead of self-reported specs, which installed models actually fit, and which loaded models are really resident in VRAM versus spilled to CPU. It closes the gap the website's browser-side checker can't — verifying a deployment on the machine it runs on. And since August 2026 it chats, with every reply measured.
On npm since August 2026 — one command, nothing to clone, zero dependencies beyond Node itself:
npx @opensourcesai/cmdcenter serve      # dashboard at http://127.0.0.1:7717
npx @opensourcesai/cmdcenter            # one-shot human-readable report
npx @opensourcesai/cmdcenter --json     # the full report as JSON
Every release is published from public CI with npm provenance — the registry can prove each tarball was built from a public commit of the repository, and there is no other publish path. Prefer reading before running? Clone the repository and run the same commands as node src/cli.js … — npx runs exactly that source.
You need
The dashboard is a Node server with zero dependencies. Check with node --version.
New to Ollama? Start with the Ollama guide.
Detection is verified on all three, including the Apple unified-memory math below.
Stopping it, and removing it. Press Ctrl+C in the terminal running the server. It installs no service and registers no startup entry. Since the chat surface landed (August 2026) it keeps exactly one directory of its own data — your conversations and this machine’s measurement history — at %LOCALAPPDATA%\osai-cmdcenter on Windows, ~/Library/Application Support/osai-cmdcenter on macOS, or ~/.local/share/osai-cmdcenter on Linux. Delete that directory and the tool is gone without a trace beyond npx’s ordinary package cache; individual conversations can also be deleted from the Chat view itself, behind a confirm. Nothing in that directory is ever transmitted or read into a diagnostic capture.
Hardware
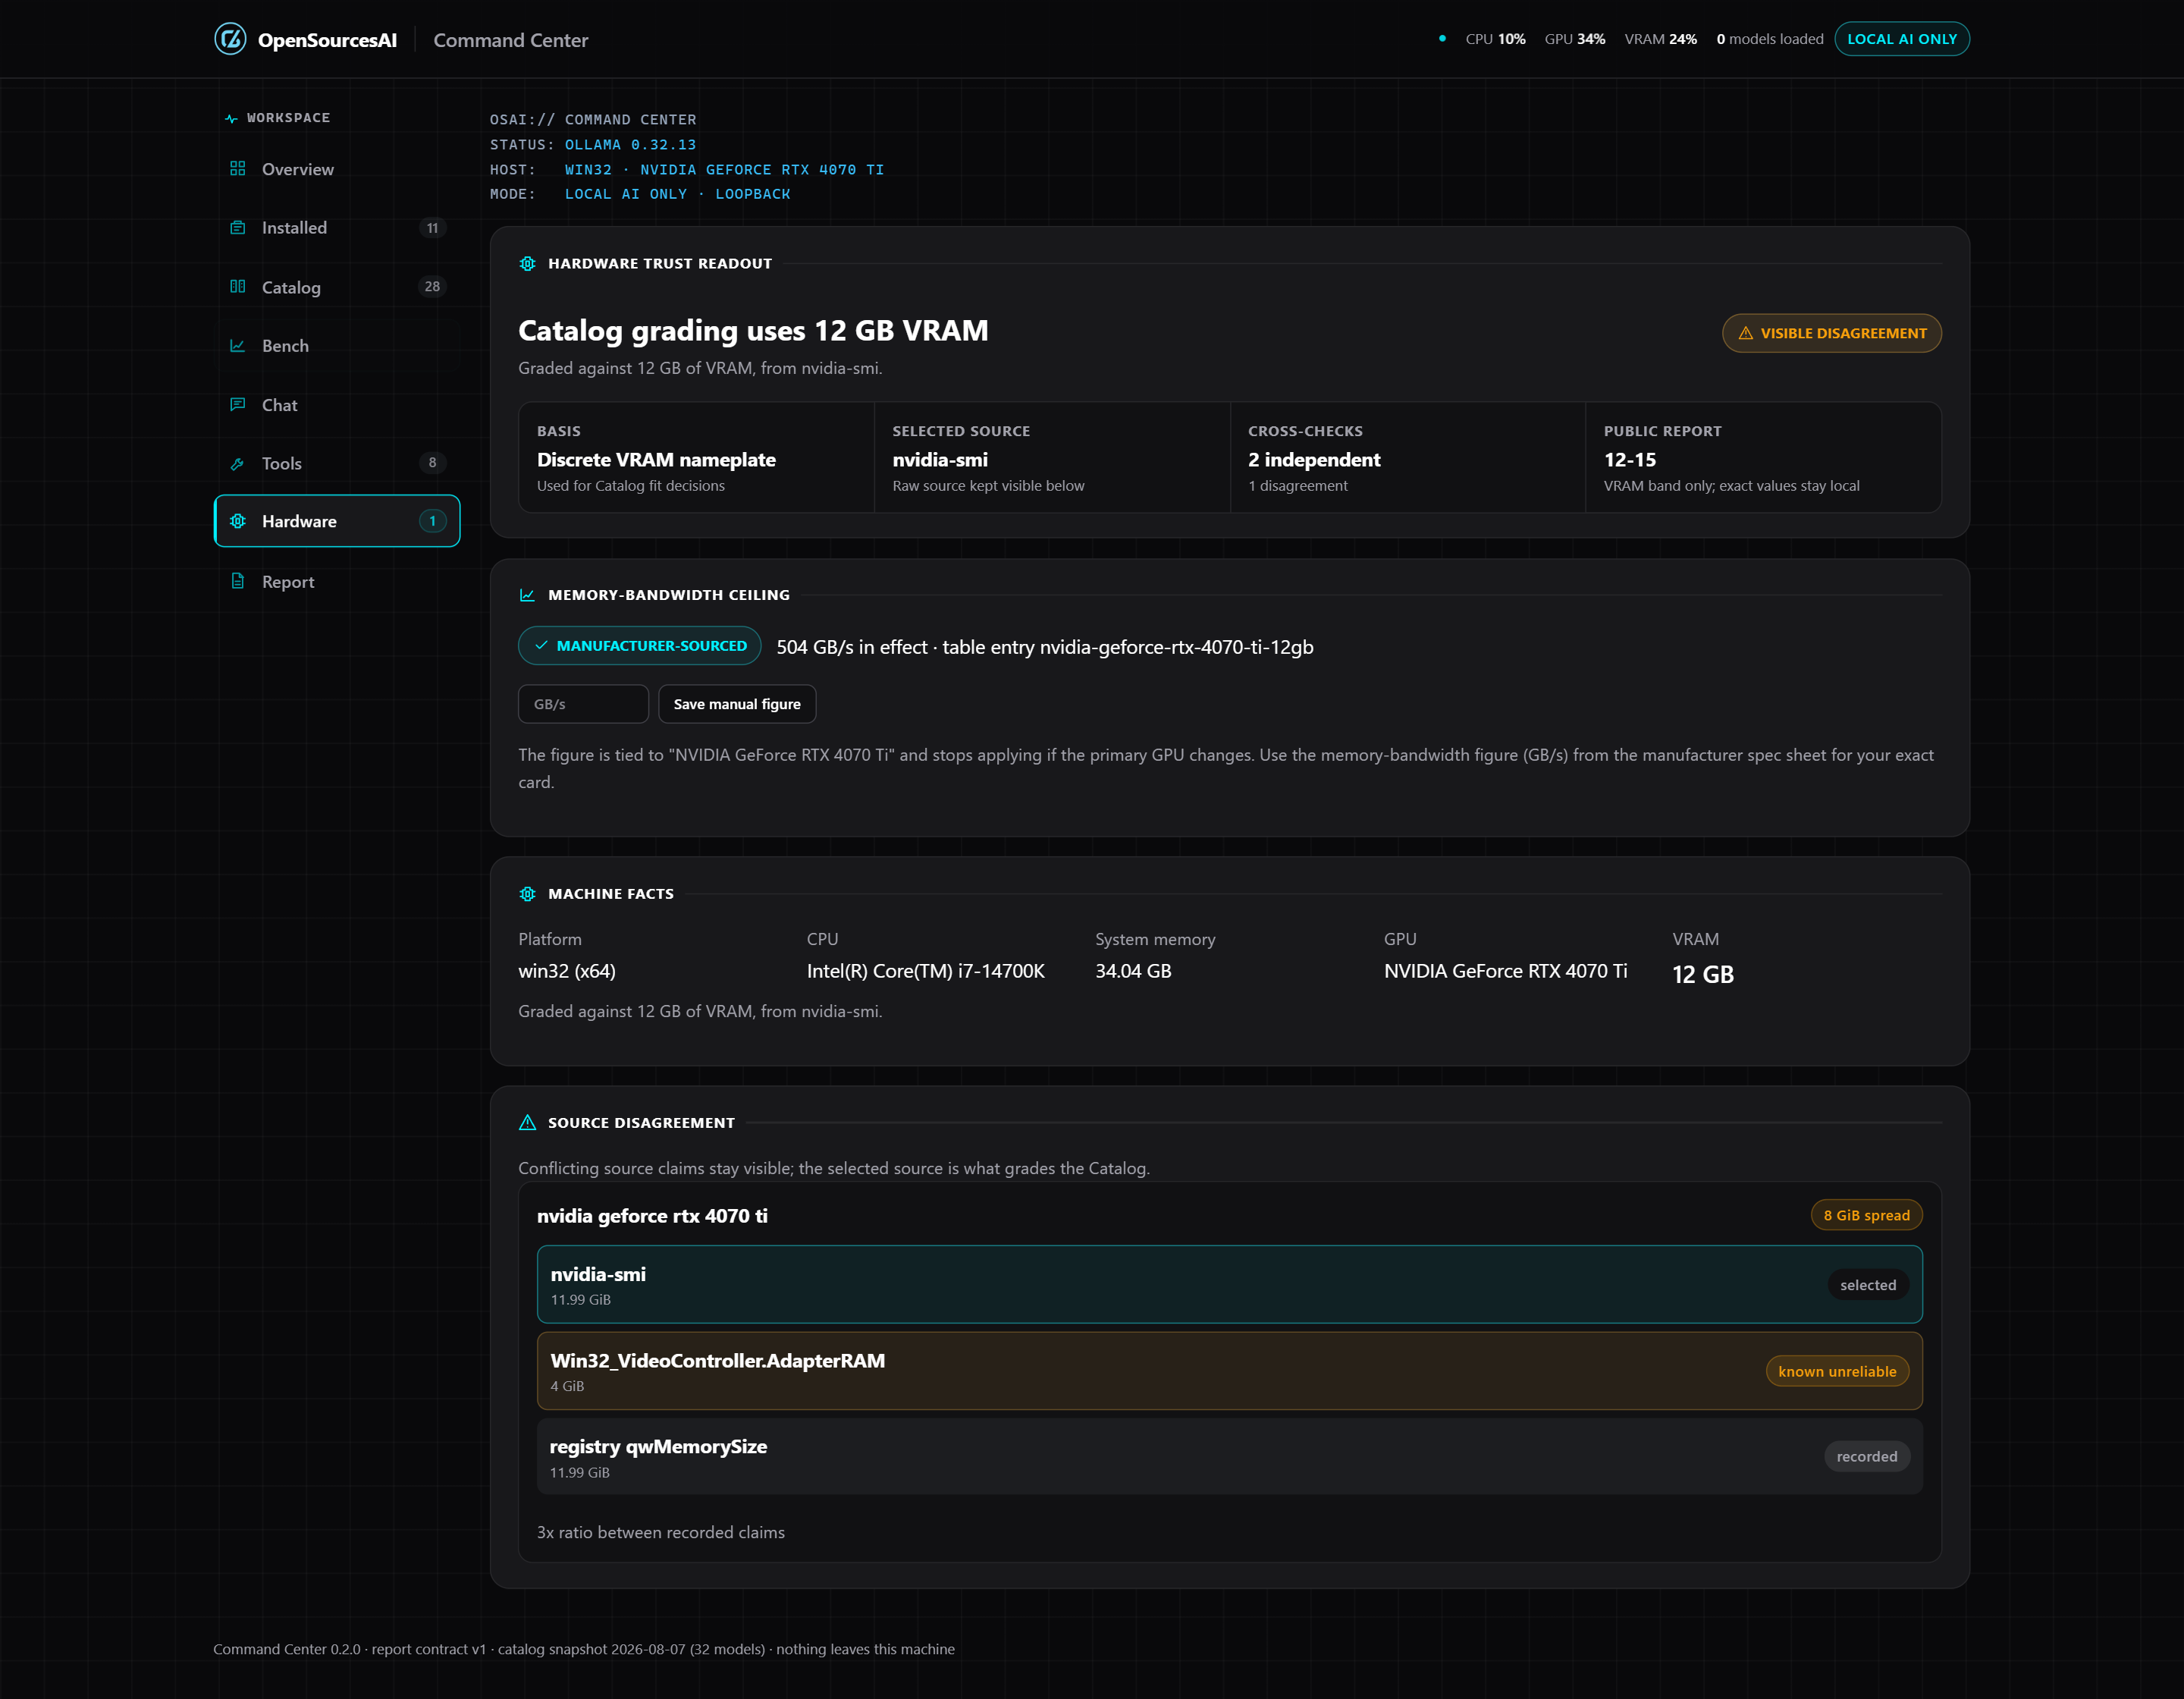
Contradictions between sources are shown, not silently resolved to whichever number looked cleaner.
Apple Silicon
A base 8 GB Mac’s real fit-relevant capacity is a full tier below its advertised total — verified against live sysctl output, not just a unit test.
Ollama
Loaded models are graded by measured VRAM residency — fully resident, partially offloaded to CPU, or CPU-only — not assumed from a model’s size alone.
Live pressure
Updated while you watch, on every platform that exposes the underlying reading.
Local tools
Lists configured MCP servers with a static verdict per server — the command located (never executed), the config judged well-formed or broken, and “unchecked” stated outright where no check ran. Secret-shaped values and local file paths are stripped during collection, never merely hidden in the UI.
Chat, measured
A chat surface where each response carries tokens per second against your machine’s sourced bandwidth ceiling, thinking-aware first-token time, a verdict on whether the fit prediction held, and your own machine’s standing best as the baseline. Works against Ollama and, optionally, a local llama.cpp server. Unavailable is never rendered as zero.
Bench results
Drop a result from the benchmark onto the Bench view — or let it find results in the shared default directory — and get medians with their variation, every honest “unavailable”, and side-by-side comparison only when the protocol’s own comparability rules are met.
Shareable summary
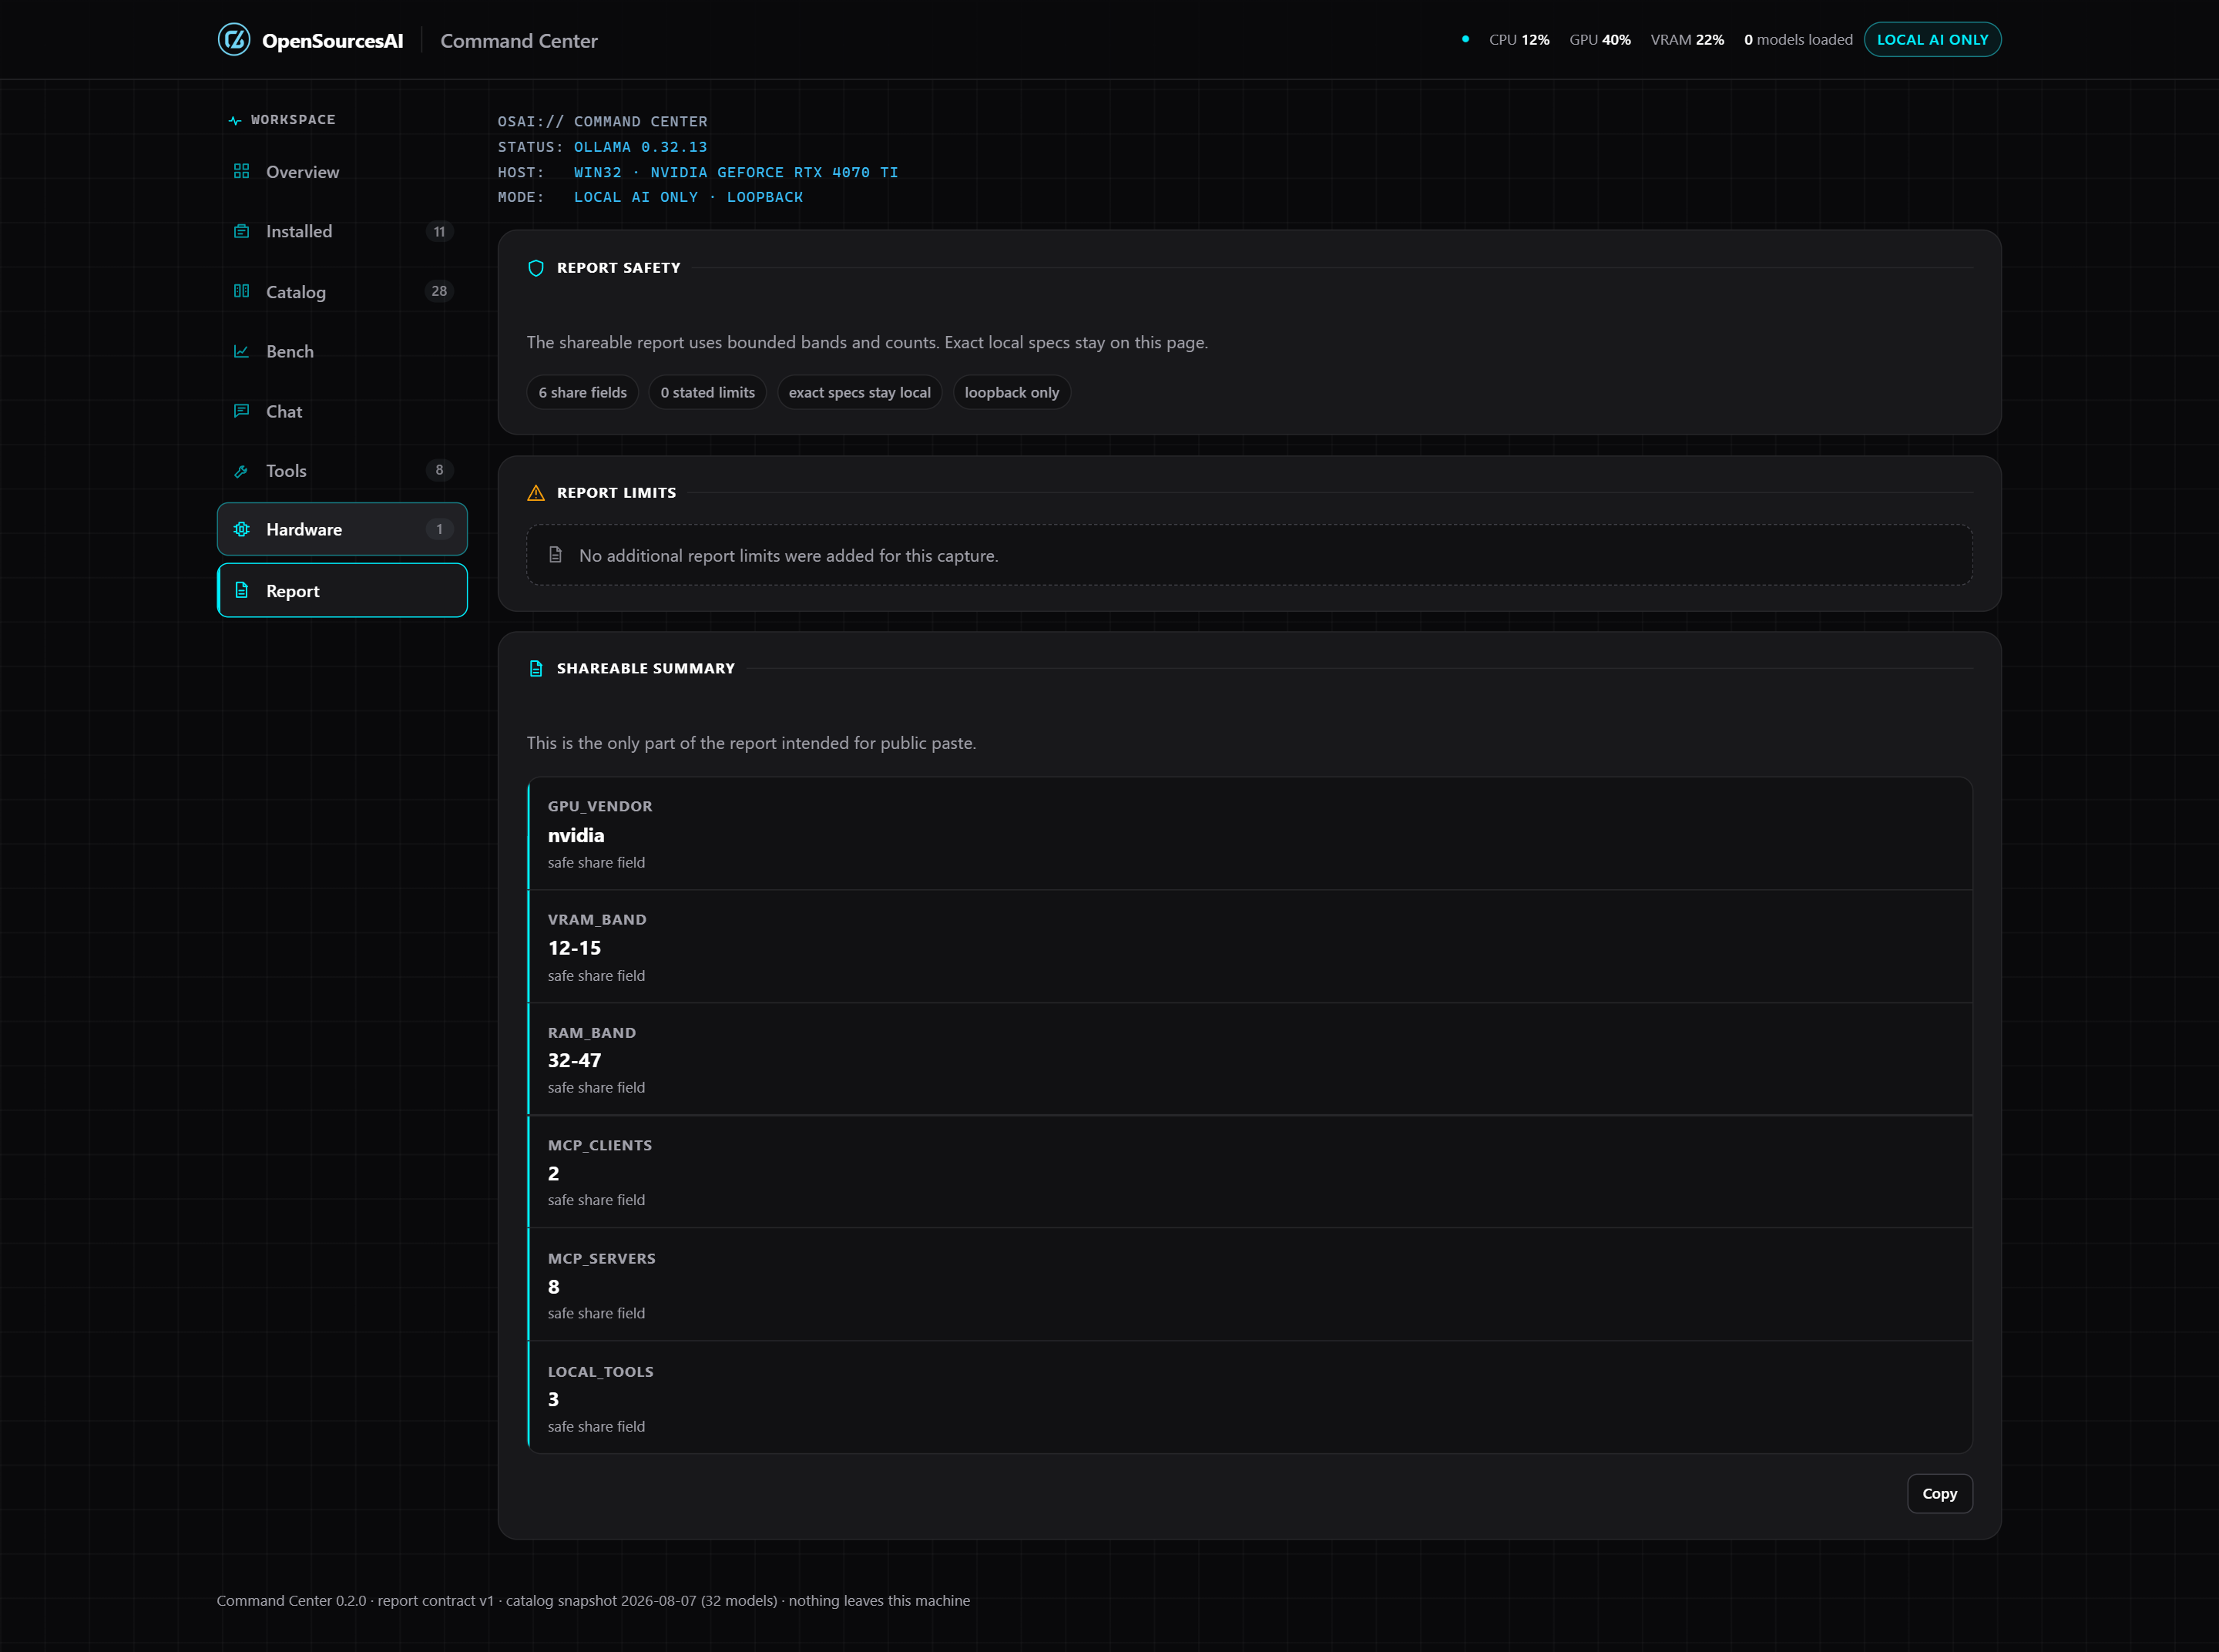
Every report ends with a share block built only from closed-vocabulary bands and counts — a GPU vendor class, a VRAM band, a RAM band. Your exact figures, model names and file paths stay on your screen, so the block is safe to drop into a public issue or forum thread.
ollama psIf you already use ollama ps, keep using it. It ships with Ollama, it costs nothing to run, and it answers its question honestly: what is loaded right now, and how much of it landed on the GPU. Nothing here replaces it.
What it can’t tell you is whether that split was avoidable. Command Center reads the same runtime numbers and sets them beside the three facts that explain them.
How much VRAM you actually have. Read from every source your platform exposes rather than one. Where two sources disagree — and on Windows they routinely do, because one common interface tops out at about 4 GB and will happily report that for a 12 GB card — both figures are shown and the disagreement is named, instead of being quietly resolved to whichever number looked cleaner.
Whether your models fit it. A committed catalog snapshot is graded against your measured memory — comfortable, tight, runs-but-offloaded, or too large — with the quantization that fits and the exact ollama run command for it. A command appears only where the catalog carries a real registry-verified tag; the tool will not synthesize one, because a copy-pasteable command that 404s is worse than no command.
Residency, in context. A model sitting at 60% in VRAM is a fact ollama ps reports too. The useful version is that number next to the card it’s running on, the headroom left, and the quantization that would have fit whole.
The only mutating actions are load and unload for models already installed on your machine. Both are self-undoing: loading tells you upfront what it may evict, and neither one pulls, deletes, pushes, creates, or copies anything.
Loopback-only
Binds to 127.0.0.1 only, with a random per-session token required on every request and strict Host/Origin checks — the same class of protection real local-service attacks (DNS rebinding, CSRF) target.
No phone-home
Not stubbed out or disabled by a flag — there is no code path that sends anything anywhere. Read the source and verify.
No command endpoint
There is no arbitrary-command surface at all, by construction — not something bolted on and then mitigated.
Plenty of Ollama setups have no desktop at all — a spare tower in a cupboard, a home server, a rented Linux box — and you drive them from a laptop. That works, and the way it works is deliberately inflexible in one specific respect.
There is no flag to put the dashboard on your network. The bind address is the loopback literal 127.0.0.1, written into the source with a test that fails the build if it ever changes. --port moves the port; nothing moves the address. So the usual way a local dashboard ends up quietly reachable from the rest of the house — a well-meaning --host 0.0.0.0 — is not available to you, and is not available to anyone who talks you into it either.
The supported way in is an SSH tunnel, which keeps every guarantee above intact. Start the server on the machine Ollama runs on:
nohup npx @opensourcesai/cmdcenter@latest serve --port 7717 < /dev/null > /tmp/cmdcenter.log 2>&1 & disown
The < /dev/null is not decoration, and it is the part people leave out. Without it the server keeps the SSH channel open and your terminal appears to hang — even with nohup and disown — which reads as a failure when the server has in fact started perfectly. Redirecting standard input closes the channel and gives you your prompt back. The log file is where any startup error will be.
Then, from your laptop, in a new terminal — not inside the SSH session you just used:
ssh -N -L 7717:127.0.0.1:7717 your-server
Leave that running and open http://127.0.0.1:7717/ in your browser. There is no token to copy or paste: the server hands it to the page itself. The dashboard is still bound to loopback on the server, still requires the per-session token on every request, and still checks the Host and Origin headers. The tunnel changes where the loopback connection comes from, not what is guarding it.
Use the same port number on both sides. The Origin check is pinned to the port the server was started on, so forwarding local 7718 to remote 7717 leaves you with a dashboard that loads and reads fine but refuses its two actions. Matching the numbers avoids the whole question.
Five things that have actually gone wrong, and what each one really means. None of them are what the error message suggests.
channel 3: open failed: connect failed: Connection refused, repeating. The tunnel is fine. That message is the tunnel reporting that it arrived and found nothing — nothing is listening on 127.0.0.1:7717 at the far end, which nearly always means the server isn’t running. Check the log you redirected it to.
serve printed nothing, exited immediately, and the log is empty. The server never started, and the cause is the command rather than the machine. A bare npx @opensourcesai/cmdcenter runs whatever it first cached, and one published release — 0.2.0 — shipped a binary that exited silently without starting anything. It was fixed in 0.2.1, but a machine that ran the broken one once keeps launching it out of the npx cache, while npm view reports the current version and npm pack downloads it — so every check you think to run says the package is fine. The tunnel then answers with Connection refused and sends you back to SSH, which was never the problem. Clear the cache once, and pin the version so it cannot return:
rm -rf ~/.npm/_npx
npx @opensourcesai/cmdcenter@latest serve --port 7717
Permission denied when the tunnel tries to bind the local port on Windows. Not a permissions problem, whatever the wording says: something on your own machine already holds 127.0.0.1:7717. An earlier tunnel you never closed is the usual culprit. Close it rather than forwarding to a different local port — see the matching-ports note above.
A host-key prompt for a machine you are already logged into. The tunnel command was run inside the SSH session instead of on your laptop, so the server is being asked to SSH to itself. Open a second terminal locally and run it there.
“Ollama not detected” while Ollama is plainly running. The Ollama Windows app sets OLLAMA_HOST=0.0.0.0, and that one variable means two incompatible things: to the Ollama server it is the address to listen on, to a client it is the address to connect to. 0.0.0.0 is a sensible instruction to listen everywhere and a meaningless place to dial, so a client that takes it at face value fails instantly on a machine where Ollama is working perfectly. Command Center already handles this — a wildcard address falls back to loopback, keeping any non-default port you set. It’s written up here because the same variable breaks other local AI tools the same way, and the symptom never points at the cause.
A measured chat surface, not a chat product. This page used to say “not a chat client”, and until August 2026 that was true. It now has a chat view — but the point is the instrument: every reply arrives with its own measured figures and a verdict on whether the machine kept the fit engine’s promise. If you want a full-featured chat frontend, keep the one you have; this one exists to tell you what your machine actually did while it answered.
Not a fleet or enterprise tool. It reports on the one machine it runs on, and it never compares your machine to anyone else’s.
Still no installer. It ships as plain source on npm — npx runs it directly on Node. No OS installer, no code signing, no auto-update; releases are published only from public CI, with provenance the registry can verify.
Exactly two actions, and inference — nothing else. Load and unload remain the entire action surface. The chat view additionally relays inference to the AI runtimes on your machine — Ollama, and optionally a local llama.cpp server — and that is the entire list: it talks only to AI runtimes on this machine, never to the internet, and nothing else in Ollama’s API is reachable through it.
Detection is the genuinely hard part of a tool like this, and machines differ in ways no test suite anticipates — every platform quirk it handles today got found on somebody’s real hardware. A number that looks wrong is worth reporting, not working around.
Bug reports
A VRAM figure that doesn’t match your card, a GPU it can’t see, a platform that behaves differently — all useful, and none of it too small to file. Open an issue →
Attach the evidence
--capturenpx @opensourcesai/cmdcenter --capture prints the raw collected data — what the tool saw before it interpreted anything, which is usually what a fix turns on. Credentials never enter it: values inside MCP env blocks are not read at all, only the variable names; command and config paths are cut down to a bare filename; filesystem errors have path-shaped text replaced. It is not a blanket scrub, though — your Ollama binary and model-store paths are in there, and on most systems those contain your home directory — so give it the same glance you’d give any log before pasting it.
Questions
Not sure whether what you’re seeing is a bug or just your setup? Ask before you file — no question about local AI is too basic there. Join the Discord server →
Next steps